Google Classroom
GeoGebra
GeoGebra Classroom
登入
搜尋
Google Classroom
GeoGebra
GeoGebra Classroom
綱要
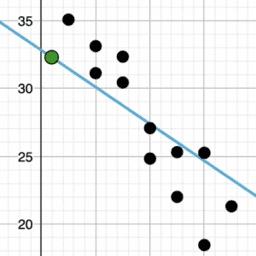
Describing Trends in Scatter Plots: IM 8.6.5
Lesson 8.6.5
Practice 8.6.5
Describing Trends in Scatter Plots: IM 8.6.5
作者:
GeoGebra Classroom Activities
,
IM 6 – 8 Math
主題:
代數
,
等式
,
Linear Equations
,
統計
“Describing Trends in Scatter Plots”
from IM Grade 8 by
Open Up Resources
and Illustrative Mathematics. Licensed under the
Creative Commons Attribution 4.0 license
.
目錄
Lesson 8.6.5
IM 8.6.5 Lesson: Describing Trends in Scatter Plots
Practice 8.6.5
IM 8.6.5 Practice: Describing Trends in Scatter Plots
下一步
IM 8.6.5 Lesson: Describing Trends in Scatter Plots
最新資源
Average Rate of Change: Graph a Function (2)
alg2_05_05_01_slider_practice_flvs
alg2_05_05_04_applet_exp_fxn_flvs
Poorly Drawn Parallelograms
Construct a Conic
探索資源
circ4colori
Standard Normal Distribution
thirds
Simple Equations - Rotation vs. Time - Sim to Sim - Non Ex 1
Decimals presented on a shaded square
探索主題
三角形
特殊點
百分率
對稱
菱形